
In this next installment on how to improve your qPCR gene profiling (see 6 Tips to Improve qPCR for previous discussion), we would like to discuss the limitations of melting curve analysis and PCR inhibitors.
Tip #3. Melting curve analysis is NOT sufficient for assessing qPCR product specificity.
In a melting curve analysis, the number of peaks is commonly used to determine the purity of qPCR products, but is this accurate enough? While having only one peak may be a good indicator of product purity, melting curve analysis can produce both false negatives and positives. Here’s how:
In dye-based qPCR, a DNA-binding dye (e.g., SYBR® Green) fluoresces when bound to double-stranded DNA (dsDNA, i.e. your qPCR product), and this increase in fluorescence as dsDNA is produced over time is quantified. In contrast, a melting curve analysis is essentially the opposite measurement. In a melting curve analysis, temperature is gradually increased to “melt” or dissociate dsDNA products. As the dsDNA dissociates, it loses fluorescence and this loss in fluorescence with respect to temperature is what a melting curve peak represents.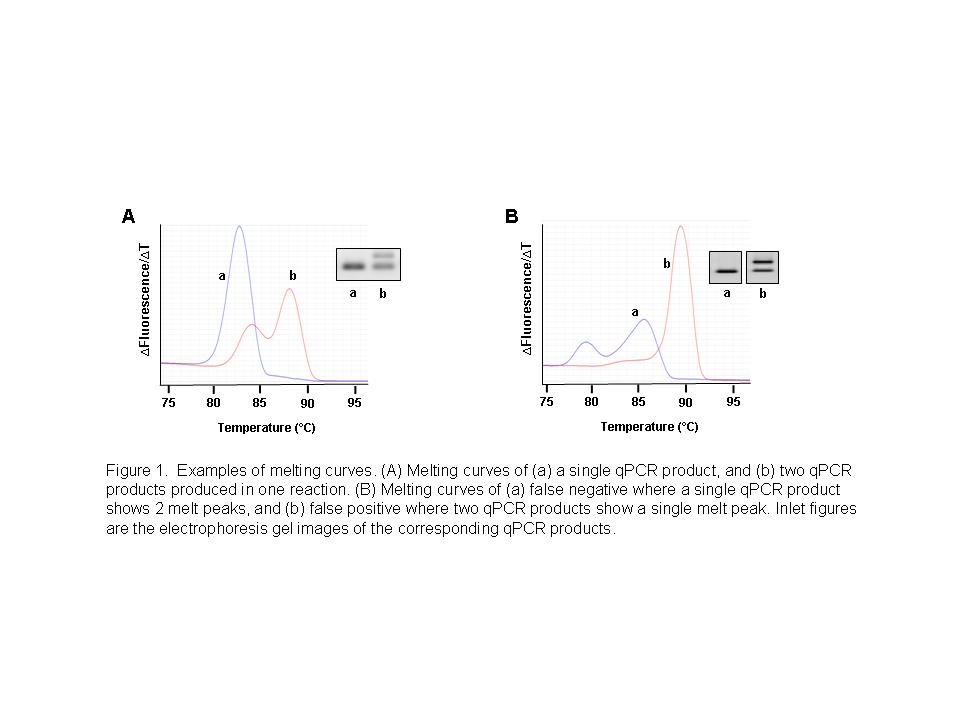
The theory behind using a melting curve to determine product specificity relies on the idea that dsDNA products of varying sizes or composition melt at different temperatures to produce distinct melt peaks. Thus, if your qPCR primers yield two products in the same reaction, a melting curve analysis would show two peaks (Fig 1A). This principle is based on the assumption that the dsDNA product is relatively uniform in composition. While it holds for most situations, a false negative can occur when the A-T and G-C bonds of your qPCR product are not uniformly distributed. For example, if your product contains a GC-rich region, the other more uniform regions may melt first giving a partial loss in fluorescence and producing a peak. An additional peak would be produced for the same product once the melting temperature of the GC-rich region is reached resulting in a bi-modal melting curve for a single product (Fig 1B, curve a). Alternatively, false positives can also occur when the G-C content of one PCR product compensates for its size difference to another product in the same reaction (Fig 1B, curve b). Although this may seem improbable, we have observed this first-hand here at ScienCell. This is why we validate all of our GeneQuery™ primers by both melting curve analysis and gel electrophoresis to ensure the purest qPCR products.
Tip #4. Know the sources of PCR inhibitors.
Even if your qPCR primers have been meticulously optimized, external factors may affect your amplification efficiency and skew your results. One such external factor that reduces your amplification efficiency is PCR inhibitors, which we will discuss here.
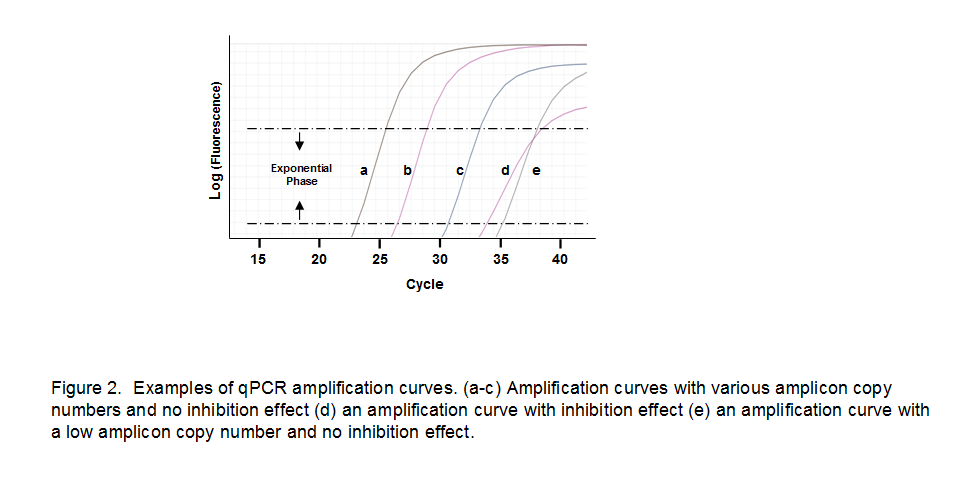
PCR inhibitors are any substance that prevents DNA amplification, thereby lowering your PCR efficiency and falsely increasing your Cq (quantification cycle), which refers to the cycle in which the fluorescent amplification signal becomes detectable. Examining the exponential phase of an amplification curve can help you determine if your PCR is inhibited. Fluorescence typically doubles with each additional cycle in the exponential phase of an efficient qPCR reaction; a lower slope would indicate that fluorescence is not doubling and suggest that PCR inhibitors may be present in your reaction (Fig 2, curve d). Compare this to an amplification curve of a reaction with a low copy number. The curve has a high Cq value, but the slope remains unaltered (Fig 2, curve e).
 Sadly, PCR inhibitors can be introduced at any step. Examples of PCR inhibitors include proteins that may be present in the original samples such as hemoglobin, melanin, heparin, and polysaccharides; or compounds introduced during sample preparation such as NaCl, KCl, phenol, ethanol, isopropanol and SDS. One easy way to prevent inhibition is to dilute any potential inhibitors by using less cDNA template. ScienCell’s GeneQuery™ primers guarantee high sensitivity with as little as 0.1 ng of cDNA, even for genes with a low copy number. In addition, each ScienCell GeneQuery™ kit includes an internal Positive PCR Control (PPC) to assess PCR efficiency. The PPC is a predispensed synthetic DNA template not present in the human genome and a primer set to amplify it. A Cq value of PPC greater than 30 suggests the presence of PCR inhibitors in your PCR reactions.
In our next post, we will discuss our last 2 tips to improve your qPCR:
Tip #5. Good Laboratory Practice (GLP) with pipetting helps to improve qPCR accuracy.
Tip #6. Use a separate reverse transcription step to optimize your qRT-PCR.
For more information, please visit https://sciencellonline.com/en/products-services/genetics-genomics/, or email info@sciencellonline.com.